DTF film utilization benchmark: manual vs auto-nesting
We laid out 670 items from 4 published order batches twice —
by scripted hand-style row layout and with NestSheet’s production auto-nest —
on the same 600 mm roll. Manual reached
84.7% film utilisation, auto-nesting
93.3%: 9.2% less film for identical artwork.
Method, dataset and limitations below.
Published 2026-07-11 · benchmark run 2026-07-11 · engine build c67ca18f · by NestSheet team, Editorial team
Results
The numbers, batch by batch
Same items, same roll, same gap and margins — the only variable is who lays the sheet out.
Batch
Items
Manual — sheet length
Manual — utilisation
Auto — sheet length
Auto — utilisation
Film saved
Small Mixed (20 items)
20
480 mm
75.3%
420 mm
86%
12.5%
Medium DTF Batch (100 items)
100
3,194 mm
87.5%
3,030 mm
92.2%
5.1%
Realistic DTF Mix (150 items)
150
4,469 mm
89.5%
4,317 mm
92.6%
3.4%
Large Production Run (400 items)
400
15,898 mm
83.1%
14,064 mm
93.9%
11.5%
All batches (film-weighted)
670
14.424 m²
84.7%
13.098 m²
93.3%
9.2%
Across 4 DTF order batches (670 items), auto-nesting averaged 93.3% film utilisation vs 84.7% for the best of three scripted hand-layout strategies — 9.2% less film for the same artwork (NestSheet Film Utilization Benchmark, July 2026).
“Manual” above is the best of three scripted hand-layout strategies per
batch, not the worst — the full per-strategy numbers are in the
results CSV. The gap is honest arithmetic,
not a brochure comparison against a clumsy strawman.
Method
What we measured, in one paragraph
If a claim on this page cannot be recomputed from the published CSVs, it does not belong on this page.
Utilisation = total artwork area ÷ film area consumed. Artwork area is
the sum of each placed item’s bounding box (width × height in mm). Film area is the
full roll width × the sheet length the layout actually used — measured identically for
both methods as the lowest item edge plus the bottom margin. It is the same formula the
builder shows live while a sheet packs, reported here to one decimal. Both layouts of
every batch were machine-validated before publication: every item placed, zero overlaps,
nothing outside the printable area.
film saved = 1 − (auto film area ÷ manual film area)
Two consequences worth stating plainly: bounding boxes mean a transparent corner counts
as “used” artwork, so this metric measures layout efficiency, not ink
coverage; and because both methods are scored by the identical rule, the manual-vs-auto
gap is a fair comparison even where the absolute numbers flatter both sides equally.
Setup
Benchmark setup
Product defaults, production engine, no tuning.
Roll width
600 mm — the builder’s standard 60 cm roll preset
Edge margin
5 mm (product default)
Item gap
2 mm (product default)
Rotation
0° / 90°, allowed for both methods
Engine
NestSheet’s production auto-nest — a MaxRects-family rectangle solver with duplicate-run grouping; exactly what every plan, including Free, runs today. No experimental engines, no benchmark-only settings.
Solve time
5–48 ms per batch on desktop hardware (Node v25.6.0)
Provenance
Run 2026-07-11, engine build c67ca18f; deterministic — re-running the harness on this build reproduces every figure exactly
Dataset
The batches — published, downloadable
Every item that was nested, as CSV. Swap in your own order list and the whole benchmark re-runs on your work, not ours.
Batch
Distinct designs
Items
Artwork area
Small Mixed (20 items)
8
20
0.217 m²
Medium DTF Batch (100 items)
8
100
1.676 m²
Realistic DTF Mix (150 items)
14
150
2.399 m²
Large Production Run (400 items)
10
400
7.926 m²
Item sizes run from small left-chest badges to 300 mm back prints, in the duplicate-heavy
mixes DTF production actually sees. Honesty note: these are the order-batch fixtures we test
the engine against — modelled on typical DTF job mixes, not customer orders.
NestSheet has no customer-order dataset and will not pretend otherwise; when we can benchmark
on real production orders (with permission), this page gets re-run and re-dated.
A scripted stand-in for careful hand layout — taken at its best, and labelled as what it is.
Nobody hand-placed 670 rectangles for this page, and we won’t invent an
operator who did. Instead the baseline scripts the row-by-row way sheets get laid out by hand
in an image editor, three different ways, and publishes the best result of the three
for every batch:
Grouped rows — one design per row band, each design in the orientation that fits the most copies across the roll: the classic duplicate-run layout.
Mixed rows, laid flat — every item landscape, sorted tallest first, rows shared between designs, each item dropped into the first row with space left.
Mixed rows, count-oriented — the same row filling, but each design keeps whichever orientation packs more copies across the width.
The script never gets tired, never nudges a row crooked and never loses count — so if it errs,
it errs in manual layout’s favour. What it deliberately does not do is the thing
hand layout also doesn’t do at production pace: reshuffle earlier rows to squeeze a
later item into a gap. That reshuffling is precisely the job the solver automates.
See it
The same 20 items, both ways
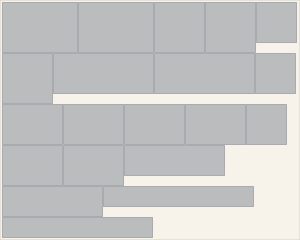
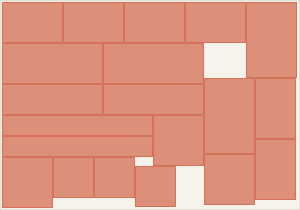
Rendered straight from the benchmark’s placement coordinates — these are the measured layouts, not illustrations.
Manual-style rows — 480 mm of roll,
75.3% utilisation
Auto-nested — 420 mm of roll,
86% utilisation
The same arithmetic as the film savings calculator, applied to the benchmark averages.
film at auto = film per month × (manual utilisation ÷ auto utilisation)
saving = (film per month − film at auto) × your price per m²
Worked example with a deliberately round, hypothetical volume: a shop running
100 m² of film a month at this benchmark’s manual average would need about
90.8 m² at the auto average — 9.2 m² of film less, every month,
multiplied by whatever you actually pay per square metre. We don’t publish film prices;
put your own into the film savings calculator and
use your measured utilisation, not our averages.
Limitations
Where this benchmark stops
Published limits are the price of a number you can trust.
Bounding boxes, not true shapes. Both methods pack rectangles. Irregular artwork with big transparent corners packs — and measures — differently; a shape-aware comparison would need its own methodology.
Modelled batches. The four batches are engine-test fixtures modelled on production job mixes, not sampled customer orders (we don’t have those — and say so above).
A scripted manual baseline. Real operators occasionally beat their own averages on a lucky mix — and do worse at 6 pm on sheet forty. We benchmarked the repeatable version of careful, not the best hand layout ever laid.
One roll width. Everything ran on the 600 mm preset. Wider rolls give any packer more room, so treat these figures as one point, not a curve.
Layout efficiency ≠ ink coverage. Utilisation here counts bounding-box area, so it overstates “printed” area for both methods equally. It is a film-consumption metric, not an ink metric.
No downstream constraints. The run ignores cut-friendliness, peel order and per-customer grouping — real sheets sometimes trade a point of utilisation for a straighter knife line.
Reproduce it
Check us on your own orders
A benchmark you can’t reproduce is an advert. This one you can check two ways.
Recompute the published run. Both CSVs above carry everything the formula needs — batch composition, sheet lengths, film areas. Every utilisation figure on this page recomputes from them by hand.
Measure your own work. Put a real order through the free plan: drop the files, let auto-nest lay the sheet on your roll width, and read the film figures straight off the builder. Then lay the same batch out the way you do today and compare sheet lengths — that number is worth more to you than any of ours.
This page re-runs and re-dates with every engine release that changes packing behaviour —
the run date and engine build in the header are the versioning. More on how the packer works:
auto-nesting, and on measuring your current sheets:
how tight is your gang sheet?
FAQ
Related questions
Can you reuse DTF film?
No — DTF film is single-pass. Once a sheet runs through the printer, the unprinted areas are waste, which is why utilisation is worth measuring: every percentage point of empty film is film you paid for and cannot recover.
How many 10×10 images fit on a 22×60 gang sheet?
Twelve only if the designs touch edge-to-edge (6×10″ is exactly 60″). With a production 2 mm gap and 5 mm margins, ten fit — two columns of five. The working is in our gang sheet size chart.
What size gang sheet do I need?
Match the roll you actually print on: common DTF rolls run 30 to 60 cm wide, with sheet lengths of 60 to 300 cm sold by suppliers. The size chart covers standard sizes and how many designs each holds.
Measure your utilisation on a real order.
The same engine as this benchmark, on your files and your roll — free plan, no card.
Dataset + results published as CSV·Deterministic, re-runnable method·Re-run on every engine release
Cookies on nestsheet.com
With your consent we use Google Analytics cookies to understand
traffic and for remarketing. Decline and none are set — Google
receives only anonymous, cookieless signals. Details in the
cookie policy.